
by A. Berglar
Visualisation-aided Research
1. Observation or scientific question
All scientific research starts with an observation and a related question.
In this example we are trying to find out about the exact looks of the SARS-CoV-2 virus (outside and inside), as well as about the mechanisms of its entering the host cell and the release of RNA.
2. Literature and image research
I start by familiarising myself with the topic and research question.
Have there been similar observations in the past? If yes, how do they relate to the current question?
In this example, I needed to collect the major proteins that are present in the SARS-CoV-2 virus and necessary for the entry into the host cell, i.e. additional proteins on the host cell surface.
I read about the mechanism of virus entry into the host cell and about the mechanism of RNA release. I need to pay attention to all the little details in order to imagine (and later visualise) the cellular scenery as accurately as possible. Therefore, I collect visual material, too.
This can be images that are as close to reality as it gets, microscopic and crystal structures if possible. It'll also be schematic images that describe pathways and mechanisms related to the topic I am interested in.

Examples of references that inform about the outside looks of the virus.

Examples of references that inform about the inside looks of the virus.
3. Model- and Hypothesis building
I collect the building blocks for the final model by sketching the previously researched information in relation to each other, for example in terms of size and location. I investigate as many details about the molecular scenery as possible. In this example these include information such as:
-
spike proteins wiggle in order to find receptors
-
open and closed conformations of spike protein
-
host receptors that are involved
-
assembly of nucleocapsid
-
manner of RNA wrapping around the N-protein
In state-of-the-art research where little is known about the answer to the research question, this process helps building the molecular environment around the phenomenon of interest, thereby coming up with hypotheses and experimental ideas.

4. experimental confirmation
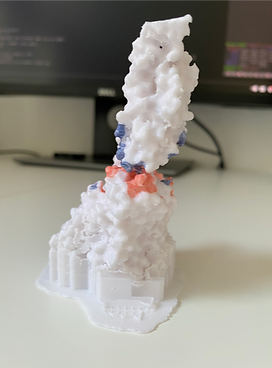
At this point, the hypotheses and ideas from the previous step are tested either by me through design experiments & bioinformatic tools, or by the client experimentally in the lab, or both. Methods I use include analyses of protein structures and interactions with docking and structure analysis tools, but also 3D assembly of protein complexes, or 3D printing of such. The use of 3D printed proteins as a jigsaw approach to docking can help to access novel insights and is great for complementing actual docking results that have been obtained through bioinformatic tools such as Haddock.
In this present example, this step was not necessary.
5. Visual Process
The visualisation process can be split into the dynamic part of "scientific visualisation" and the part of "mediative visualisation ".
Scientific visualisation in this context refers to the gain of knowledge through visualisation, while mediative visualisation refers to the final product that summarises these discoveries in an image or animation for the purpose of communication.


6. Final products and applications
The final product(s) can be anything from a line drawing over a single fully rendered image to an image series or animation. These can be used for several purposes such as further developing ideas in this research area, use as infographics or journal covers (as shown in the mock-up below). Animations can advertise the respective lab's work and achievements or communicate important findings to other researchers or to the public.

